Bitcoin Golden Bottom Oscillator (MZ BTC Oscillator)This indicator uses Elliot Wave Oscillator Methodology applied on "BTC Golden Bottom with Adaptive Moving Average" and Relative Strength Index of Resulted EVO to form an Oscillator to detect trend health in Bitcoin price. Ticker is set to "INDEX : BTCUSD" on 1D timeframe.
Methodology
Oscillator uses Adaptive Moving Average with 1 year of length, Minor length of 50 and Major length of 100 to mark AMA as Golden Bottom.
Percentage Elliot Wave Oscillator is calculated between BTC price and AMA.
Relative Strength Index of EVO is calculated to detect trend strength and divergence detection.
Hull Moving Average of resulted RSI is used to smoothen the Oscillator.
Oscillator is hard coded to 'INDEX:BTCUSD' ticker on 1d so it can be used on any other chart and on any other timeframe.
Color Schemes
Bright Red background color indicates that price has left top Fib multiple ATR band and possibly go for top.
Light Red background color indicates that price has left 2nd top Fib multiple ATR band and possibly go for local top.
Lime background color indicates that price has entered lowest band indicating local bottom.
Bright Green background color indicates that price is approximately resting on Golden Bottom i.e. AMA.
Oscillator color is set to gradient for easy directional adaption.
BTC Golden Bottom with Adaptive Moving Average
Cerca negli script per "relative strength"

Combo 4+ KDJ STO RSI EMA3 Visual Trend Pine V5@RL! English !
Combo 4+ KDJ STO RSI EMA3 Visual Trend Pine V5 @ RL
Combo 4+ KDJ STO RSI EMA3 Visual Trend Pine V5 @ RL is a visual trend following indicator that groups and combines four trend following indicators. It is compiled in PINE Script Version V5 language.
• STOCH: Stochastic oscillator.
• RSI Divergence: Relative Strength Index Divergence. RSI Divergence is a difference between a fast and a slow RSI.
• KDJ: KDJ Indicator. (trend following indicator).
• EMA Triple: 3 exponential moving averages (Default display).
This indicator is intended to help beginners (and also the more experienced ones) to trade in the right direction of the market trend. It allows you to avoid the mistakes of always trading against the trend.
The calculation codes of the different indicators used are standard public codes used in the usual TradingView coding for these indicators.
The STO indicator calculation script is taken from TradingView's standard STOCH calculation.
The RSI indicator calculation script is a replica of the one created by @Shizaru.
The KDJ indicator calculation script is a replica of the one created by @iamaltcoin.
The Triple EMA indicator calculation script is a replica of the one created by @jwilcharts.
This indicator can be configured to your liking. It can even be used several times on the same graph (multi-instance), with different configurations or display of another indicator among the four that compose it, according to your needs or your tastes.
A single plot, among the 4 indicators that make it up, can be displayed at a time, but either with its own trend or with the trend of the 4 (3 by default) combined indicators (sell=green or buy=red, background color).
Trend indications (potential sell or buy areas) are displayed as a background color (bullish: green or bearish: red) when at least three of the four indicators (3 by default and configurable from 1 to 4) assume that the market is moving in the same direction. These trend indications can be configured and displayed, either only for the signal of the selected indicator and displayed, or for the signals of the four indicators together and combined (logical AND).
You can tune the input, style and visibility settings of each indicator to match your own preferences or habits.
A 'buy stop' or 'sell stop' signal is displayed (layouts) in the form of a colored square (green for 'stop buy' and red for 'stop sell'. These 'stop' signals can be configured and displayed, either only for the indicator chosen, or for the four indicators together and combined (logical OR).
Note that the presence of a Stop Long signal cancels the background color of the Long trend (green).
Likewise, the presence of a Stop Short signal cancels out the background color of the Short trend (red).
It is also made up of 3 labels:
• Trend Label
• signal Stop Label (signals Stop buy or sell )
• Info Label (Names of Long / Short / Stop Long / Stop Short indicators, and / Open / Close / High / Low ).
Each label is configurable (visibility and position on the graph).
• Trend label: indicates the number of indicators suggesting the same trend (Long or Short) as well as a strength index (PWR) of this trend: For example: 3 indicators in Short trend, 1 indicator in Long trend and 1 indicator in neutral trend will give: PWR SHORT = 2/4. (3 Short indicators - 1 Long indicator = 2 Pwr Short). And if PWR = 0 then the display is "Wait and See". It also indicates which current indicator is displayed and the display mode used (combined 1 to 4 indicators or not combined ).
• Signal Stop Label: Indicates a possible stop of the current trend.
• Label Info (Simple or Full) gives trend info for each of the 4 indicators and OHLC info for the chart (in “Full” mode).
It is possible to display this indicator several times on a chart (up to 3 indicators max with the Basic TradingView Plan and more with the paid plans), with different configurations: For example:
• 1-Stochastic - 2/4 Combined Signals - no Label displayed
• 1-RSI - Combined Signals 3/4 - Stop Label only displayed
• 1-KDJ - Combined Signals 4/4 - the 3 Labels displayed
• 1-EMA'3 - Non-combined signals (EMA only) - Trend Label displayed
Some indicators have filters / thresholds that can be configured according to your convenience and experience!
The choice of indicator colors is suitable for a graph with a "dark" theme, which you will probably need to modify for visual comfort, if you are using a "Light" mode or a custom mode.
This script is an indicator that you can run on standard chart types. It also works on non-standard chart types but the results will be skewed and different.
Non-standard charts are:
• Heikin Ashi (HA)
• Renko
• Kagi
• Point & Figure
• Range
As a reminder: No indicator is capable of providing accurate signals 100% of the time. Every now and then, even the best will fail, leaving you with a losing deal. Whichever indicator you base yourself on, remember to follow the basic rules of risk management and capital allocation.
BINANCE:BTCUSDT
**********************************************************************************************************************************************************************************************************************************************************************************
! Français !
Combo 4+ KDJ STO RSI EMA3 Visual Trend Pine V5@RL
Combo 4+ KDJ STO RSI EMA3 Visual Trend Pine V5@RL est un indicateur visuel de suivi de tendance qui regroupe et combine quatre indicateurs de suivi de tendance. Il est compilé en langage PINE Script Version V5.
• STOCH : Stochastique.
• RSI Divergence : Relative Strength Index Divergence. La Divergence RSI est une différence entre un RSI rapide et un RSI lent.
• KDJ : KDJ Indicateur. (indicateur de suivi de tendance).
• EMA Triple : 3 moyennes mobiles exponentielles (Affichage par défaut).
Cet indicateur est destiné à aider les débutants (et aussi les plus confirmé) à trader à dans le bon sens de la tendance du marché. Il permet d'éviter les erreurs qui consistent à toujours trader à contre tendance.
Les codes de calcul des différents indicateurs utilisés sont des codes publics standards utilisés dans le codage habituel de TradingView pour ces indicateurs !
Le script de calcul de l’indicateur STO est issu du calcul standard du STOCH de TradingView.
Le script de calcul de l’indicateur RSI Div est une réplique de celui créé par @Shizaru.
Le script de calcul de l’indicateur KDJ est une réplique de celui créé par @iamaltcoin.
Le script de calcul de l’indicateur Triple EMA est une réplique de celui créé par @jwilcharts
Cet indicateur peut être configuré à votre convenance. Il peut même être utilisé plusieurs fois sur le même graphique (multi-instance), avec des configurations différentes ou affichage d’un autre indicateur parmi les quatre qui le composent, selon vos besoins ou vos goûts.
Un seul tracé, parmi les 4 indicateurs qui le composent, peut être affiché à la fois mais, soit avec sa propre tendance soit avec la tendance des 4 (3 par défaut) indicateurs combinés (couleur de fond vente=vert ou achat=rouge).
Les indications de tendance (zones de vente ou d’achat potentielles) sont affichés sous la forme de couleur de fond (Haussier : vert ou baissier : rouge) lorsque au moins trois des quatre indicateurs (3 par défaut et configurable de 1 à 4) supposent que le marché évolue dans la même direction. Ces indications de tendance peuvent être configuré et affichés, soit uniquement pour le signal de l’indicateur choisi et affiché, soit pour les signaux des quatre indicateurs ensemble et combinés (ET logique).
Vous pouvez accorder les paramètres d’entrée, de style et de visibilité de chacun des indicateurs pour correspondre à vos propres préférences ou habitudes.
Un signal ‘stop achat’ ou ‘stop vente’ est affiché (layouts) sous la forme d’un carré de couleur (vert pour ‘stop achat’ et rouge pour ‘stop vente’. Ces signaux ‘stop’ peuvent être configuré et affichés, soit uniquement pour l’indicateur choisi, soit pour les quatre indicateurs ensemble et combinés (OU logique).
A noter que la présence d’un signal Stop Long annule la couleur de fond de la tendance Long (vert).
De même, la présence d’un signal Stop Short annule la couleur de fond de la tendance Short (rouge).
Il est aussi composé de 3 étiquettes (Labels) :
• Trend Label (infos de tendance)
• Signal Stop Label (signaux « Stop » achat ou vente)
• Infos Label (Noms des indicateurs Long/Short/Stop Long/Stop Short,
et /Open/Close/High/Low )
Chaque label est configurable (visibilité et position sur le graphique).
• Label Trend : indique le nombre d’indicateurs suggérant une même tendance (Long ou Short) ainsi qu’un indice de force (PWR) de cette tendance :
Par exemple : 3 indicateurs en tendance Short, 1 indicateur en tendance Long et 1 indicateur en tendance neutre donnera :
PWR SHORT = 2/4. (3 indicateurs Short – 1 indicateur Long=2 Pwr Short).
Et si PWR=0 alors l’affichage est « Wait and See » (Attendre et Observer).
Il indique aussi quel indicateur actuel est affiché et le mode d’affichage utilisé (combiné 1 à 4 indicateurs ou non combiné ).
• Signal Stop Label : Indique un possible arrêt de la tendance en cours.
• Infos Label (Simple ou complet) donne les infos de tendance de chacun des 4 indicateurs et les infos OHLC du graphique (en mode « Complet »).
Il est possible d’afficher ce même indicateur plusieurs fois sur un graphique (jusqu’à 3 indicateurs max avec le Plan Basic TradingView et plus avec les plans payants), avec des configurations différentes :
Par exemple :
• 1-Stochastique – Signaux Combinés 2/4 – aucun Label affiché
• 1-RSI – Signaux Combinés 3/4 – Label Stop uniquement affiché
• 1-KDJ – Signaux Combinés 4/4 – les 3 Labels affichés
• 1-EMA’3 - Signaux Non combinés (EMA seuls) – Trend Label affiché
Certains indicateurs ont des filtres/seuils (Thresholds) configurables selon votre convenance et votre expérience !
Le choix des couleurs de l’indicateur est adapté pour un graphique avec thème « sombre », qu’il vous faudra probablement modifier pour le confort visuel, si vous utilisez un mode « Clair » ou un mode personnalisé.
Ce script est un indicateur que vous pouvez exécuter sur des types de graphiques standard. Il fonctionne aussi sur des types de graphiques non-standard mais les résultats seront faussés et différents.
Les graphiques Non-standard sont :
• Heikin Ashi (HA)
• Renko
• Kagi
• Point & Figure
• Range
Pour rappel : Aucun indicateur n’est capable de fournir des signaux précis 100% du temps. De temps en temps, même les meilleurs échoueront, vous laissant avec une affaire perdante. Quel que soit l’indicateur sur lequel vous vous basez, n’oubliez pas de suivre les règles de base de gestion des risques et de répartition du capital.
BINANCE:BTCUSDT

Best Currency Strength Indicator By Mahfuz AzimBest Currency Strength Indicator is a visual guide that demonstrates which currencies are currently strong, and which ones are weak.
FX Currency strength indicators include multiple calculation to choose from
1. Relative Strength Index ( RSI )
2. True Strength Index (TSI)
3. Absolute Strength Index (ASI)
4. Linear Regression Slope ( LRS )
5. Rate of Change ( ROC ) and
6. Z-Score

Relative Volume & RSI PopThis is a basic idea/script designed to take a breakout trade by taking advantage of volume spikes when price/strength is extended (either long or short).
The script only utilises two indicators, the Relative Volume (RV) and the Relative Strength Index (RSI). The script allows the user to select a RSI value between 69 up to 100 for a long trade and between 35 down to 0 for short trade and then pair this with RV from 0 - 10. The period for both the RSI and RV can also be amended by the user but I found in most cases there was no benefit gained by changing away from normal "14" period lookback. The script typically only has small draw downs as the script is designed to exit the trade when the RSI returns back to "normalised" level, therefore the trades are generally quite short. The exit condition for a long trade is when RSI crosses back below 69 (which is why you cannot enter a long below this value) and for a short the, trade will close when RSI crosses back above 35 (which is why you cannot enter a short above this value). These exit values are locked.
By allowing RSI value to go all the way up to "100" on the long side and "0" on the short side this in effect is a way of eliminating the script from taking either longs or shorts if lets say you wanted to back test the script for long only spikes or short only spike. E.G. By setting RSI upper value to "75" the RV to "1" and RSI lower value to "0" then no short trades will not be taken in your back test as the RSI never really gets down to zero.
I put this together with meme stocks in mind and back tested it on day charts for AMC and then a few trending style stocks too. It typically worked best as long only and with RSI settings between 71 - 75 and RV at 1 or 1.5. I also found it had okay results on some lower 1hr timeframe futures markets and weekly time frames too (albeit trades were few and far between on weekly timeframe).
The beauty of such a basic script you could easily set up a trading view screener to look for these opportunities everyday and perhaps even add in an ADX filter on the screener to see if the trend is increasing. Then use this script to run a back test on the stocks that you've selected from the screener.

Bollinger Band Width PercentileIntroducing the Bollinger Band Width Percentile
Definitions :
Bollinger Band Width Percentile is derived from the Bollinger Band Width indicator.
It shows the percentage of bars over a specified lookback period that the Bollinger Band Width was less than the current Bollinger Band Width.
Bollinger Band Width is derived from the Bollinger Bands® indicator.
It quantitatively measures the width between the Upper and Lower Bands of the Bollinger Bands.
Bollinger Bands® is a volatility-based indicator.
It consists of three lines which are plotted in relation to a security's price.
The Middle Line is typically a Simple Moving Average.
The Upper and Lower Bands are typically 2 standard deviations above, and below the SMA (Middle Line).
Volatility is a statistical measure of the dispersion of returns for a given security or market index, measured by the standard deviation of logarithmic returns.
The Broad Concept :
Quoting Tradingview specifically for commonly noted limitations of the BBW indicator which I have based this indicator on....
“ Bollinger Bands Width (BBW) outputs a Percentage Difference between the Upper Band and the Lower Band.
This value is used to define the narrowness of the bands.
What needs to be understood however is that a trader cannot simply look at the BBW value and determine if the Band is truly narrow or not.
The significance of an instruments relative narrowness changes depending on the instrument or security in question.
What is considered narrow for one security may not be for another.
What is considered narrow for one security may even change within the scope of the same security depending on the timeframe.
In order to accurately gauge the significance of a narrowing of the bands, a technical analyst will need to research past BBW fluctuations and price performance to increase trading accuracy. ”
Here I present the Bollinger Band Width Percentile as a refinement of the BBW to somewhat overcome the limitations cited above.
Much of the work researching past BBW fluctuations, and making relative comparisons is done naturally by calculating the Bollinger Band Width Percentile.
This calculation also means that it can be read in a similar fashion across assets, greatly simplifying the interpretation of it.
Plotted Components of the Bollinger Band Width Percentile indicator :
Scale High
Mid Line
Scale Low
BBWP plot
Moving Average 1
Moving Average 2
Extreme High Alert
Extreme Low Alert
Bollinger Band Width Percentile Properties:
BBWP Length
The time period to be used in calculating the Moving average which creates the Basis for the BBW component of the BBWP.
Basis Type
The type of moving average to be used as the Basis for the BBW component of the BBWP.
BBWP Lookback
The lookback period to be used in calculating the BBWP itself.
BBWP Plot settings
The BBWP plot settings give a choice between a user defined solid color, and a choice of "Blue Green Red", or "Blue Red" spectrum palettes.
Moving Averages
Has 2 Optional User definable and adjustable moving averages of the BBWP.
Visual Alerts
Optional User adjustable High and low Signal columns.
How to read the BBWP :
A BBWP read of 95 % ... means that the current BBW level is greater than 95% of the lookback period.
A BBWP read of 5 % .... means that the current BBW level is lower than 95% of the lookback period.
Proposed interpretations :
When the BBWP gets above 90 % and particularly when it hits 100% ... this can be a signal that volatility is reaching a maximum and that a macro High or Low is about to be set.
When the BBWP gets below 10 % and particularly when it hits 0% ...... this can be a signal that volatility is reaching a minimum and that there could be a violent range breakout into a trending move.
When the BBWP hits a low level < 5 % and then gets above its moving average ...... this can be an early signal that a consolidation phase is ending and a trending move is beginning.
When the BBWP hits a high level > 95 % and then falls below its moving average ... this can be an early signal that a trending move is ending and a consolidation phase is beginning.
Essential knowledge :
The BBWP was designed with the daily timeframe in mind, but technical analysists may find use for it on other time frames also.
High and Low BBWP readings do not entail any direction bias.
Deeper Concepts :
In finance, “mean reversion” is the assumption that a financial instrument's price will tend to move towards the average price over time.
If we apply that same logic to volatility as represented here by the Bollinger band width percentile, the assumption is that the Bollinger band width percentile will tend to contract from extreme highs, and expand from extreme lows over time corresponding to repeated phases of contraction and expansion of volatility.
It is clear that for most assets there are periods of directional trending behavior followed by periods of “consolidation” ( trading sideways in a range ).
This often ends with a tightening range under reducing volume and volatility ( popularly known as “the squeeze” ).
The squeeze typically ends with a “breakout” from the range characterized by a rapid increase in volume, and volatility when price action again trends directionally, and the cycle repeats.
Typical Use Cases :
The Bollinger Band Width Percentile may be especially useful for Options traders, as it can provide a bias for when Options are relatively expensive, or inexpensive from a Volatility (Vega) perspective.
When the Bollinger Band Width Percentile is relatively high ( 85 percentile or above ) it may be more advantageous to be a net seller of Vega.
When the Bollinger Band Width Percentile is relatively low ( 15 percentile or below ) it may be advantageous to be net long Vega.
Here we examine a number of actionable signals on BTCUSD daily timeframe using the BBWP and a momentum oscillator ( using the TSI here but can equally be used with Bollinger bands, moving averages, or the traders preferred momentum oscillator ).
In this first case we will examine how a spot trader and an options trader could each use a low BBWP read to alert them to a good potential trade setup.
note: using a period of 30 for both the Bollinger bands and the BBWP period ( approximately a month ) and a BBWP lookback of 350 ( approximately a year )
As we see the Bollinger Bands have gradually contracted while price action trended down and the BBWP also fell consistently while below its moving average ( denoting falling volatility ) down to an extremely low level <5% until it broke above its moving average along with a break of range to the upside ( signaling the end of the consolidation at a low level and the beginning of a new trending move to the upside with expanding volatility).
In this next case we will continue to follow the price action presuming that the traders have taken or locked in profit at reasonable take profit levels from the previous trade setup.
Here we see the contraction of the Bollinger bands, and the BBWP alongside price action breaking below the BB Basis giving a warning that the trending move to the upside is likely over.
We then see the BBWP rising and getting above its moving average while price action fails to get above the BB Basis, likewise the TSI fails to get above its signal line and actually crosses below its zeroline.
The trader would normally take this as a signal that the next trending move could be to the downside.
The next trending move turns out to be a dramatic downside move which causes the BBWP to hit 100% signaling that volatility is likely to hit a maximum giving good opportunities for profitable trades to the skilled trader as outlined.
Limitations :
Here we will look at 2 cases where blindly taking BBWP signals could cause the trader to take a failed trade.
In this first example we will look at blindly taking a low volatility options trade
Low Volatility and corresponding low BBWP levels do not automatically mean there has to be expansion immediately, these periods of extreme low volatility can go on for quite some time.
In this second example we will look at blindly taking a high volatility spot short trade
High volatility and corresponding high BBWP levels do not automatically mean there has to be a macro high and contraction of volatility immediately, these periods of extreme high volatility can also go on for quite some time, hence the famous saying "The trend is your friend until the end of the trend" and lesser well known, but equally valid saying "never try to short the top of a parabolic blow off top"
Markets are variable and past performance is no guarantee of future results, this is not financial advice, I am not a financial advisor.
Final thoughts
The BBWP is an improvement over the BBW in my opinion, and is a novel, and useful addition to a Technical Analysts toolkit.
It is not a standalone indicator and is meant to be used in conjunction with other tools for direction bias, and Good Risk Management to base sound trades off.
John Bollinger has suggested using Bolliger bands, and its related indicators with two or three other non-correlated indicators that provide more direct market signals.
He believes it is crucial to use indicators based on different types of data.
Some of his favored technical techniques are moving average divergence/convergence (MACD), on-balance volume and relative strength index (RSI).
Thanks
Massive respect to John Bollinger, long-time technician of the markets, and legendary creator of both the Bollinger Bands® in the 1980´s, and the Bollinger band Width indicator in 2010 which this indicator is based on.
His work continues to inspire, decades after he brought the original Bollinger Bands to the market.
Much respect also to Eric Crown who gave me the fundamental knowledge of Technical Analysis, and Options trading.

Quantitative Qualitative Estimation QQE
The QQE indicator is a momentum based indicator to determine trend and sideways.
The Qualitative Quantitative Estimation (QQE) indicator works like a smoother version of the popular Relative Strength Index (RSI) indicator. QQE expands on RSI by adding two volatility based trailing stop lines. These trailing stop lines are composed of a fast and a slow moving Average True Range (ATR). These ATR lines are smoothed making this indicator less susceptible to short term volatility.
The most common method of using QQE is to look for crosses of the fast and slow moving trailing stop lines during periods when the QQE line reflects overbought or oversold conditions
Qualitative Quantitative Estimation made up of a smoothed Relative Strength Index (RSI) indicator plus fast and slow volatility-based trailing levels.
Qualitative Quantitative Estimation can be used in two directions:
1.Determine the trend, i.e. if the line is above the 50 level, the trend is ascending, if below - descending;
2.Search for signals at the moment of crossing of the QQE FAST (maroon) and QQE SLOW (blue) lines.
The QQE itself is generally considered to indicate an up-trend ifQQE FAST is above QQE SLOW, and a down-trend if below QQE SLOW.
Often a middle-range between 40 and 60 is set and if the indicator is in that range, then the market is considered to be tracking sideways, or in no trend.
You will need to set only one parameter – “SF” "RSI SMoothing Factor", an analogue of the period in RSI.
By the way, judging from the open source information, the algorithm used the standard strength index with a period of 14 for calculations.
Various signals can be created from the indicator such as:
-Buy when QQE FAST crosses above QQE SLOW below 50 level or just buy when QQE lines crosses above 50 level.
-Sell when QQE FAST crosses below QQE SLOW above 50 level or just sell when QQE lines crosses below 50 level.
WARNING: QQE IS A RSI BASED INDICATOR SO THAT IT CAN TRIGGER FALSE SIGNALS DURING DIVERGENCES!
Kıvanç Özbilgiç

SectorsThis script attempts to show the relative strength of the 11 sectors in the SPX, which can be accomplished in three ways:
1. Sectors - displays all sector indices as they appear normally
2. Sector Relativity - displays each sector divided by the sum of the other 10 sectors
3. Sector Alpha - displays the alpha of each sector as compared to the sum of the other 10 sectors
I have seen some other iterations of this script that compare each sector to the SPX as a whole, a couple problems with that:
1. SPX sector weightings are unequal and change quarterly, meaning you will get an inaccurate depiction of relative sector strength across time.
2. Even if using an equal-weight SPX, you would be comparing a sector to itself as all 11 sectors are included in the SPX, not just the complementary 10 you are looking to compare one sector to.
For more information on the sectors in the SPX or the calculation of Alpha, visit the links at the top of the script.
*Includes an option for repainting -- default value is true, meaning the script will repaint the current bar.
False = Not Repainting = Value for the current bar is not repainted, but all past values are offset by 1 bar.
True = Repainting = Value for the current bar is repainted, but all past values are correct and not offset by 1 bar.
In both cases, all of the historical values are correct, it is just a matter of whether you prefer the current bar to be realistically painted and the historical bars offset by 1, or the current bar to be repainted and the historical data to match their respective price bars.
As explained by TradingView,`f_security()` is for coders who want to offer their users a repainting/no-repainting version of the HTF data.

FX Currency Strength IndicatorFX Currency strength indicator is a visual guide that demonstrates which currencies are currently strong, and which ones are weak.
FX Currency strength indicators include multiple calculation to choose from
1. Relative Strength Index (RSI)
2. True Strength Index (TSI)
3. Absolute Strength Index (ASI)
4. Linear Regression Slope (LRS)
5. Rate of Change (ROC)
6. Z-Score
Three display modes
1. Lines
2. Columns
3. Areas

stock gain% vs index gain %This shows the relative strength or weakness of a stock vs an index on any given candle price movement.
Negative stock candle and relative strength shows accumulation
Positive stock candle and relative weakness shows distribution
accumulation will plot an 'A'
distribution will plot a 'D'

Currency Relative Strengths [GM] - Data IndicatorI created this tool for the purpose of determining strongest and weakest currencies over different periods of time. Each major currency is compared to the field of other majors and its average change is measured over a predetermined period of time. The result is displayed as a percentage. I use it for trend following but it can also be used to fade exhaustion.
Instructions
Add indicator to chart
Select a time frame under settings
Place cursor over period of interest
Click "Data Window" on right hand side bar
View % change avg values for each currency

VaRz BTC/Gold Risk MeterVaRz Risk Meter (BTC vs Risk-On & Gold Safe-Haven Proxy)
The VaRz Risk Meter is a macro sentiment oscillator designed to measure Bitcoin’s relative strength and directional bias using key risk-appetite and safe-haven flows.
Indicator Components
VIX → Market fear & volatility benchmark
NASDAQ 100 (NDX) → Primary risk-on proxy (growth/tech capital flow)
Gold (XAUUSD) → Safe-haven strength alternative to USD index
Bitcoin (BTCUSDT) → Used only for normalization reference, not bias calculation
Core Logic
All assets are normalized on a 0–100 scale using a 100-period rolling window to create a balanced comparison across markets.
The Bitcoin Macro Bias Histogram is calculated as:
NASDAQ strength − VIX fear − Gold safe-haven strength
This produces a macro directional regime for Bitcoin:
Market Regimes Interpretation
Indicator State Meaning for BTC
NASDAQ high + VIX low + Gold weak Risk-On environment → Bullish for Bitcoin
Gold strong + VIX rising + NASDAQ weak Risk-Off / flight to safety → Bearish pressure on BTC
All assets near 50 with no trend Neutral / Sideways → Macro indecision
How to Use
This is not a direct entry signal, but a macro bias filter
Best combined with:
Market Structure, Liquidity zones, Orderflow, Volume analysis, and Elliott Wave context
Bias becomes more reliable on higher timeframes (1W, 1M) but works on any chart
Key Insight
Bitcoin behaves as a hybrid risk asset. This indicator helps track when capital is:
Rotating into risk markets (favorable for BTC)
or
Seeking protection in gold and volatility hedges (unfavorable for BTC)
The histogram visually maps these shifts to give traders a clear macro regime awareness in one window.

Enhanced Divergence Scanner═══════════════════════════════════════════════════════════════════
TRADINGVIEW COMPLIANT POST - FOLLOWS ALL HOUSE RULES
═══════════════════════════════════════════════════════════════════
📌 TITLE:
Multi-Oscillator Divergence Detector with Pivot Validation
───────────────────────────────────────────────────────────────────
📝 COMPLIANT DESCRIPTION (addresses all moderator requirements):
───────────────────────────────────────────────────────────────────
**Multi-Oscillator Divergence Detector with Pivot Validation**
This indicator identifies regular divergences by comparing price pivot points against oscillator pivot points across three momentum indicators simultaneously.
━━━━━━━━━━━━━━━━━━━━━━━━━━━━━━━━━━━━━━━━━━━━━
**HOW THE SCRIPT WORKS (Technical Methodology):**
The script uses a multi-step validation process:
1. **Pivot Detection**: The script identifies swing highs and lows on both price and oscillators using the `ta.pivothigh()` and `ta.pivotlow()` functions with configurable left/right lookback periods.
2. **Divergence Validation**: When a new pivot is detected, the script scans historical pivots to find potential divergence pairs where:
- For Bullish: Price makes a lower low while the oscillator makes a higher low
- For Bearish: Price makes a higher high while the oscillator makes a lower high
3. **Line Integrity Check**: Before confirming a divergence, the script draws a temporary test line between the two pivot points and checks if any intermediate price/oscillator values pierce through this line. Only non-pierced divergences are displayed.
4. **Multi-Oscillator Confirmation**: The divergence is checked against RSI, CCI, and MFI independently. The label shows how many oscillators confirmed the same divergence (1, 2, or 3).
━━━━━━━━━━━━━━━━━━━━━━━━━━━━━━━━━━━━━━━━━━━━━
**WHY COMBINE THESE THREE OSCILLATORS:**
Each oscillator measures momentum differently, providing complementary confirmation:
- **RSI (Relative Strength Index)**: Measures the speed and magnitude of recent price changes. Calculated as: RSI = 100 - (100 / (1 + RS)), where RS = Average Gain / Average Loss over the period.
- **CCI (Commodity Channel Index)**: Measures price deviation from the statistical mean. Calculated as: CCI = (Typical Price - SMA) / (0.015 × Mean Deviation). Effective for identifying cyclical turning points.
- **MFI (Money Flow Index)**: A volume-weighted RSI that incorporates buying/selling pressure. Calculated using typical price × volume to create money flow, then applying RSI formula. Adds volume confirmation to momentum analysis.
When multiple oscillators show divergence simultaneously, it suggests stronger conviction in the potential reversal signal.
━━━━━━━━━━━━━━━━━━━━━━━━━━━━━━━━━━━━━━━━━━━━━
**WHAT MAKES THIS SCRIPT UNIQUE:**
1. **Pivot-Based Validation**: Unlike simple divergence indicators that compare consecutive values, this script validates divergences between actual swing points, reducing false signals.
2. **Line Piercing Filter**: The script ensures no intermediate price action invalidates the divergence by checking if prices cross the divergence line.
3. **Triple Confirmation System**: Shows signal strength (1-3) based on how many oscillators agree on the divergence.
4. **Visual Confirmation Status**: Dotted lines indicate unconfirmed (recent) divergences; solid lines indicate confirmed divergences after the lookback period passes.
━━━━━━━━━━━━━━━━━━━━━━━━━━━━━━━━━━━━━━━━━━━━━
**HOW TO USE THIS INDICATOR:**
1. **Signal Identification**:
- Green lines with up arrow (▲) = Bullish divergence (potential buy zone)
- Red lines with down arrow (▼) = Bearish divergence (potential sell zone)
2. **Signal Strength**: The number next to the arrow (1, 2, or 3) indicates how many oscillators confirmed the divergence. Higher numbers suggest stronger signals.
3. **Confirmation Status**:
- Dotted line = Divergence is still forming (may be invalidated)
- Solid line = Divergence is confirmed
4. **Best Practices**:
- Use on higher timeframes (4H, Daily) for more reliable signals
- Combine with support/resistance levels for entry timing
- Wait for price action confirmation before entering trades
- Signals with 2-3 oscillator confirmations are generally more reliable
━━━━━━━━━━━━━━━━━━━━━━━━━━━━━━━━━━━━━━━━━━━━━
**SETTINGS EXPLAINED:**
| Setting | Default | Purpose |
|---------|---------|---------|
| Pivot Lookback Left | 3 | Bars to the left required to confirm a pivot |
| Pivot Lookback Right | 1 | Bars to the right required to confirm a pivot |
| Max Historical Bars | 750 | How far back to search for divergence pairs |
| RSI/CCI/MFI Length | 14 | Period for each oscillator calculation |
| Line Width | 2 | Visual thickness of divergence lines |
| Show Labels | On | Toggle signal labels on/off |
**Adjusting for Trading Style:**
- Shorter pivot lookback = More signals, faster detection, more noise
- Longer pivot lookback = Fewer signals, slower detection, higher quality
━━━━━━━━━━━━━━━━━━━━━━━━━━━━━━━━━━━━━━━━━━━━━
**LIMITATIONS AND RISK DISCLAIMER:**
- Divergences are NOT direct buy/sell signals - they indicate potential reversals
- In strong trends, divergences may fail multiple times before working
- Past divergence patterns do not guarantee future price movement
- Always use proper position sizing and stop-loss orders
- This indicator should be used as part of a complete trading strategy
━━━━━━━━━━━━━━━━━━━━━━━━━━━━━━━━━━━━━━━━━━━━━
**OPEN SOURCE:**
This script is published open-source. You can view the complete code logic and modify it for your own use according to TradingView's guidelines.
───────────────────────────────────────────────────────────────────
🏷️ TAGS (safe tags without trademark issues):
divergence, oscillator, pivot, momentum, reversal, swing-trading, technical-analysis, multi-timeframe, price-action, trend-reversal
───────────────────────────────────────────────────────────────────
✅ COMPLIANCE CHECKLIST (based on moderator feedback):
Originality & Usefulness:
- Explained WHY these oscillators work together
- Described the unique pivot validation method
- Not just a simple mashup
Description Quality:
- Detailed explanation of underlying logic
- Step-by-step methodology explained
- How to use the indicator
- Settings explained with purpose
Vendor Requirements:
- Publishing as OPEN SOURCE (not invite-only)
- No trademark symbols (™, ®) used
- Clear value proposition explained
No House Rule Violations:
- Original description text
- Educational content included
- Proper risk disclaimer
- No misleading claims
═══════════════════════════════════════════════════════════════════

Bull/Bear vs Base vs Index (% Change Spread)Visualizes the performance gap ("Beta Decay") between 3x Leveraged ETFs (SOXL/SOXS) and their underlying sector (SOXX), relative to the S&P 500 (SPY).
This indicator is designed for traders who trade leveraged products (like SOXL/SOXS, TQQQ/SQQQ) and need to see true relative strength beyond simple price action.
It calculates the percentage change over a user-defined lookback period for four instruments:
Base (1x): The sector benchmark (Default: SOXX).
Bull (3x): The leveraged long ETF (Default: SOXL).
Bear (-3x): The leveraged inverse ETF (Default: SOXS).
Index: The broad market zero-line (Default: SPY).
It then plots the Spread to reveal the health of the trend:
Bull Spread (Green Line): Bull % - Base %
Bear Spread (Red Line): Bear % - Base %
Base vs Index (Filled Area): Base % - SPY %
🧠 The Logic: Why Use Spreads?
In a perfectly efficient trending market, a 3x Bull ETF should move exactly 300% of the underlying asset. However, in choppy or volatile markets, volatility decay (beta slippage) causes leveraged ETFs to underperform mathematically.
Positive Spread: The leveraged ETF is successfully capturing momentum (The "Sweet Spot").
Negative Spread: The leveraged ETF is suffering from drag or the underlying asset is chopping.
📈 Recommended Trading Plan
Note: This indicator works best as a filter for entry conditions, not a standalone signal. Always use proper risk management.
Strategy A: The "Clean Trend" (Momentum)
Goal: Enter a 3x position only when volatility drag is minimal.
1. Bull Signal:
Condition 1: The Base vs Index (Area) is Green (Sector is outperforming SPY).
Condition 2: The Bull Spread (Green Line) is Positive (> 0).
Why: This confirms the sector is strong AND the 3x ETF is amplifying that move efficiently without decay eating the profits.
2. Bear Signal:
Condition 1: The Base vs Index (Area) is Red (Sector is lagging SPY).
Condition 2: The Bear Spread (Red Line) is Positive (> 0).
Why: This confirms the sector is crashing and the Bear ETF is successfully capturing the downside momentum.
Strategy B: The "Decay Avoidance" (Cash is King)
Goal: Avoid leveraged funds during chop.
Condition: If BOTH the Bull Spread and Bear Spread are Negative (< 0) (below the zero line).
Action: Stay in Cash or trade the 1x underlying (SOXX) only.
Why: When both spreads are negative, it mathematically proves that the market is too choppy for leverage. Both the Long and Short leveraged funds are losing value relative to the underlying asset.
Features:
Pine Script® v6: Updated for the latest engine performance and visuals.
Dashboard Table: Real-time percentage spreads displayed directly on the chart (customizable position).
Fully Customizable: Works on any sector (e.g., set inputs to QQQ/TQQQ/SQQQ for Tech).
Disclaimer:
Trading leveraged ETFs involves significant risk. This script is for educational purposes only.

GC1 Orderflow Engine - sudoTLDR
This indicator measures relative buying and selling pressure by comparing GC1! futures returns against XAU price returns, normalized by their own volatility and weighted by GC1! volume. The result is a pressure histogram and line that show whether futures orderflow is leading, lagging, or diverging from spot gold in real time.
What this indicator does
The Orderflow Engine is designed to answer one core question:
Is GC1! futures orderflow applying net pressure in the same direction as XAU, or pushing against it?
It does this by isolating relative strength and weakness between futures and spot, rather than looking at price direction alone.
How the pressure calculation works
1. GC1! futures returns and XAU returns are calculated bar by bar
2. Each return is normalized by its own recent volatility
3. The normalized XAU return is subtracted from the normalized GC1! return
This creates a relative pressure value:
Positive pressure - GC1! futures are outperforming XAU
Negative pressure - GC1! futures are underperforming XAU
Near zero - futures and spot are moving in balance
To emphasize meaningful activity:
GC1! volume is converted into a normalized score
Higher-than-normal futures volume increases the weight of the pressure
Low-volume pressure is naturally dampened
The final output is clamped to keep the scale stable across different market conditions.
Visual output
Histogram
Green bars - positive futures pressure
Red bars - negative futures pressure
Gray bars - neutral or minimal pressure
Pressure line
A smoother view of the same pressure data
Useful for spotting momentum shifts and divergence
Zero line
Represents balance between futures and spot
Crosses often mark changes in orderflow control
Optional annotations
Regime shift markers based on futures participation
Optional percent-change labels for studying pressure acceleration
How to use it
-Confirm whether price moves are supported by futures orderflow
-Spot early divergence between GC1! and XAU
-Identify absorption , distribution , or initiative behavior
-Filter entries by trading only when pressure aligns with your bias
-This tool is best used as confirmation and context, not as a standalone signal generator.
Design philosophy
-Self-normalizing across sessions and volatility regimes
-No fixed thresholds that break over time
-Focused on relative behavior, not prediction
-Built to pair naturally with the Participation Regime indicator

RSI For Loop | PWRSI For Loop – True Dominance Oscillator
RSI For Loop – True Momentum Dominance Through Historical Comparison
The Relative Strength Index (RSI) is excellent at measuring recent price change intensity, but a reading of 70 or 30 has completely different implications depending on the market regime. RSI For Loop removes this ambiguity by transforming RSI into a clean, zero-centered dominance / percentile-rank oscillator that always tells you exactly how strong or weak the current momentum is compared to recent history.
How it works
- Standard RSI is calculated normally (default length 46).
- A simple for-loop compares the current RSI value against the actual RSI value of every previous bar inside the user-defined lookback window (default 1 to 99 bars ≈ one full quarter on daily charts).
- Current RSI higher → +1 point
- Current RSI lower → –1 point
The resulting score ranges from –99 to +99 and is naturally centered around zero:
1. +40 = current momentum beats ~70 % of the last 99 bars (approximation)
2. –60 = current momentum is weaker than ~80 % of the last 99 bars (approximation)
3. Near zero = balanced or ranging market
Additional statistical layers
- A very long rolling median of the score (default 240 periods) serves as a slow, robust dynamic centerline
- Upper and lower 3σ bands are calculated from the standard deviation of the underlying RSI median (default length 60) to highlight truly rare extreme-dominance phases
- Asymmetric trend thresholds (default Long +15 / Short –28) reflect the empirical observation that downside momentum is usually sharper and faster
Origin and development
The core idea of using a for-loop on RSI was originally introduced by @viResearch in his invite-only “RSI For Loop” script.
While studying that concept I realised I needed an even more regime-robust strength gauge that looks back far enough to capture full market cycles (2–4 months). Therefore I completely rewrote the loop to compare against actual historical RSI values instead of fixed levels, added a 240-period median centerline, 3σ extreme bands, asymmetric thresholds, and visual signals. All parameters were extensively tested across dozens of major assets (BTC, ETH, SOL, SUI, BNB, XRP, TRX, DOGE, LINK, PAXG, CVX, HYPE, VIRTUAL + 20+ more cryptos; Magnificent 7 stocks, QQQ, SPX, XAUUSD) with the goal of achieving consistent profitability, high Sortino ratio and low drawdown in simple trend-following setups.
The final defaults represent the most robust compromise found — they keep you in real trends for dozens or hundreds of bars while staying almost silent in choppy, ranging markets.
Important Note
The optimization process is tailored to MY needs and have to be adjusted to you prefered timeframe!
I was mainly looking for an indicator that shows the underlying strength of an asset, the trend componant was only a bonus in my eyes.
How to use it
1. Green triangle below bar → score crosses above +15 → new bullish regime confirmed → enter or add to longs
2. Magenta triangle above bar → score crosses below –28 → exit longs or go cash/short
While score stays clearly positive → bullish bias hold
3. Score touching or breaking the 3σ bands → extreme conviction zone (add to winners or prepare for exhaustion)
Strength
Recommended defaults (My preference)
RSI length 46
Loop range 1–99
Long threshold +15
Short threshold –28
Median length 240
SD length 60
Recommended Universal Settings (Tested for low Max-Drawdown, high Sortino)
RSI length 44
Loop range 1–60
Long threshold +14
Short threshold –10
Median length 180
SD length 28
Works on every asset class, but the current settings are tuned for major liquid markets.
Disclaimer: This is not financial advice. Backtests are based on past results and are not indicative of future performance.

PEG RSI [Auto EPS Growth]The PEG RSI is a hybrid indicator that combines fundamental valuation with technical momentum. It applies the Relative Strength Index (RSI) directly to the Price/Earnings-to-Growth (PEG) Ratio.
Unlike traditional PEG indicators that require manual input for growth rates, this script automatically calculates the Compound Annual Growth Rate (CAGR) of Earnings Per Share (EPS) based on historical data.
Key Features
- Auto-Calculated Growth: Uses historical TTM Earnings Per Share (EPS) to calculate the CAGR over a user-defined period (Default: 4 years).
- Dynamic Valuation: Converts the static PEG ratio into an oscillator (RSI) to identify relative valuation extremes.
- Trend & Momentum: Visualizes the momentum of the PEG ratio relative to its own history.
Educational Case Study
This indicator is designed for educational purposes and research. Instead of relying on fixed overbought or oversold levels, users are encouraged to study the correlation between the PEG RSI and price action independently.
- Observe how the price reacts when the PEG RSI reaches upper or lower extremes.
- Different stocks may respect different RSI zones based on their growth stability.
- Use this tool to analyze how market valuation momentum shifts over time.
Settings:
- Years for CAGR Growth: Timeframe to calculate EPS growth (Default: 4 years).
- RSI Length: Lookback period for the RSI calculation (Default: 14).
Note: This indicator works best on stocks with a consistent history of earnings. It requires financial data to function (will not work on assets without EPS like Crypto or Forex).

DarkPool's RSi DarkPool's RSi is an enhanced momentum oscillator designed to automatically detect structural discrepancies between price action and the Relative Strength Index. While retaining the standard RSI visualization, this script overlays advanced divergence recognition logic to identify potential trend reversals.
The tool identifies pivot points in real-time and compares recent peaks and valleys against historical data. When the momentum of the RSI contradicts the direction of price action, the indicator highlights these events using dynamic trendlines, shape markers, and background coloring. A built-in dashboard table provides an immediate status check of active divergence signals.
Key Features
Automated Divergence Detection: Automatically spots both Regular Bullish and Regular Bearish divergences based on pivot lookback settings.
Dynamic Visuals: Draws physical lines connecting RSI peaks or troughs to visualize the divergence angle, alongside triangle markers indicating the signal direction.
Active Status Dashboard: A data table located on the chart monitors the current state of the market, flagging signals as "Active" when detected.
Standard RSI Overlay: Includes standard Overbought (70) and Oversold (30) reference lines for traditional momentum trading.
How to Use
1. Reading the Standard RSI The black line represents the Relative Strength Index.
Overbought (Above 70): Suggests the asset may be overvalued and due for a pullback.
Oversold (Below 30): Suggests the asset may be undervalued and due for a bounce.
Midline (50): Acts as a trend filter; values above 50 indicate bullish momentum, while values below 50 indicate bearish momentum.
2. Trading Divergences The primary function of this tool is to identify reversal setups.
Bullish Divergence (Green Triangle/Line): Occurs when Price makes a Lower Low, but the RSI makes a Higher Low. This indicates that selling momentum is exhausting and a price increase may follow.
Bearish Divergence (Red Triangle/Line): Occurs when Price makes a Higher High, but the RSI makes a Lower High. This indicates that buying momentum is fading and a price decrease may follow.
3. Visual Aids
Lines: The script draws solid lines directly on the RSI pane connecting the relevant pivot points to confirm the divergence slope.
Background Color: When a divergence is detected, the background of the indicator pane will highlight briefly (Green for Bullish, Red for Bearish) to draw attention to the new signal.
4. The Dashboard A small table in the bottom right corner tracks the status of the signals.
Status: ACTIVE: A divergence has been detected within the last 10 bars.
Status: None: No recent divergence patterns have been identified.
Disclaimer This indicator is provided for educational and informational purposes only. It does not constitute financial advice, investment recommendations, or a guarantee of future results. Trading cryptocurrencies and financial markets involves a high level of risk. Always perform your own due diligence before making any trading decisions.

RSI Rate of Change (ROC of RSI)The RSI Rate of Change (ROC of RSI) indicator measures the speed and momentum of changes in the RSI, helping traders identify early trend shifts, strength of price moves, and potential reversals before they appear on the standard RSI.
While RSI shows overbought and oversold conditions, the ROC of RSI reveals how fast RSI itself is rising or falling, offering a deeper view of market momentum.
How the Indicator Works
1. RSI Calculation
The indicator first calculates the classic Relative Strength Index (RSI) using the selected length (default 14). This measures the strength of recent price movements.
2. Rate of Change (ROC) of RSI
Next, it computes the Rate of Change (ROC) of the RSI over a user-defined period.
This shows:
Positive ROC → RSI increasing quickly → strong bullish momentum
Negative ROC → RSI decreasing quickly → strong bearish momentum
ROC crossing above/below 0 → potential early trend shift
What You See on the Chart
Blue Line: RSI
Red Line: ROC of RSI
Grey dotted Zero Line: Momentum reference
Why Traders Use It
The RSI ROC helps you:
Detect momentum reversals early
Spot bullish and bearish accelerations not visible on RSI alone
Identify exhaustion points before RSI reaches extremes
Improve entry/exit precision in trend and swing trading
Validate price breakouts or breakdowns with momentum confirmation
Best For
Swing traders
Momentum traders
Reversal traders
Trend-following systems needing early confirmation signals

Ata Low rsi macd aomacd stochastic and divergensesBrief Description of the Script
The script is a multi‑indicator trading tool for the TradingView platform (Pine Script v5) that combines several technical analysis elements to help traders identify market trends, potential reversals, and entry/exit points.
эту версию скрипта не обновляю. для получения обновлений в лс.
Key features:
Multiple Oscillators
The user can select one of four oscillators to display:
RSI (Relative Strength Index) — identifies overbought/oversold conditions;
Stoch (Stochastic Oscillator) — detects potential reversals via %K and %D line interactions;
MACD (Moving Average Convergence/Divergence) — shows trend direction and momentum shifts;
AO+MACD — combines Awesome Oscillator (AO) for momentum with MACD for trend confirmation.
Divergence Detection
Identifies four types of price‑oscillator divergences:
Bullish regular (price lows vs. higher oscillator lows);
Bullish hidden (higher price lows vs. lower oscillator lows);
Bearish regular (price highs vs. lower oscillator highs);
Bearish hidden (lower price highs vs. higher oscillator highs).
Divergences are marked on the chart with labels and lines.
Customizable Parameters
Users can adjust:
Oscillator periods (e.g., RSI length, Stoch K/D smoothing, MACD fast/slow/signal lengths);
Source prices (close, high, low, etc.);
Visual settings (colors, line widths, label styles);
Divergence sensitivity (minimum bars between swing points).
Trend and Volatility Analysis
EMA crossover (fast/slow) to determine trend direction;
ATR‑based volatility score (1–5 scale);
RSI‑derived trend strength (1–50 scale);
ADX filter to confirm trend strength (>20).
Additional Signals
Awesome Oscillator “Tea Saucer” patterns for potential long/short entries;
Fibonacci‑Bollinger bands to spot price deviations and reversal zones;
Volume filter to confirm reversals;
Session timing table (optional) showing active/upcoming market sessions (Asia, London, NYSE, etc.).
Visual Outputs
Plots for selected oscillator (RSI, Stoch, MACD, or AO);
Shaded zones (e.g., RSI overbought/oversold areas);
Divergence lines and labels (color‑coded by type);
Reversal “circles” (blue for bullish, red for bearish);
Summary label with trend direction, volatility, and strength;
Optional session timing table.
Purpose:
To provide a comprehensive view of market momentum, trend, and potential reversal setups by combining oscillator crossovers, divergences, volatility, volume, and session context — helping traders time entries and exits across multiple timeframes.

VSLRT with DivergencesOverview
This indicator combines Volume-Synchronized Linear Regression Trend (VSLRT) analysis with multi-indicator divergence detection to provide comprehensive market momentum and reversal signals. It displays volume-weighted price trends in both short-term and long-term timeframes, while simultaneously detecting divergences across 10 different technical indicators.
Key Features
VSLRT (Volume-Synchronized Linear Regression Trend):
Short-term and long-term trend analysis using linear regression
Volume-weighted calculations that account for buying vs selling pressure
Color-coded histogram showing trend strength and direction
Forecast projection showing anticipated trend continuation
Divergence-adjusted forecasting for enhanced prediction accuracy
Multi-Indicator Divergence Detection:
The indicator simultaneously monitors divergences across:
MACD (Moving Average Convergence Divergence)
MACD Histogram
RSI (Relative Strength Index)
Stochastic Oscillator
CCI (Commodity Channel Index)
Momentum
OBV (On-Balance Volume)
Volume-Weighted MACD
Chaikin Money Flow
Money Flow Index
Divergence Types:
Regular Bullish Divergence (potential reversal to upside)
Regular Bearish Divergence (potential reversal to downside)
Hidden Bullish Divergence (trend continuation upward)
Hidden Bearish Divergence (trend continuation downward)
How It Works
VSLRT Calculations:
The indicator calculates linear regression slopes for both price and volume, separating buying volume from selling volume. The histogram displays:
Green columns: Bullish price movement with strong buying volume
Red columns: Bearish price movement with strong selling volume
Shaded columns: Weaker conviction in the current trend
Thick line: Long-term trend direction
Divergence Detection:
The script automatically scans for divergences by comparing:
Price action (higher highs/lower lows)
Indicator values at pivot points
When price and indicators move in opposite directions, a divergence is detected
Divergences are displayed as labels on the histogram showing:
Which indicators are diverging
Number of simultaneous divergences (stronger signal when multiple indicators agree)
Color-coded by divergence type
Customizable Settings
VSLRT Settings:
Short-term length (default: 20)
Long-term length (default: 50)
Forecast bars (1-50, default: 10)
Divergence forecast adjustment factor
Custom colors for all trend states
Divergence Settings:
Pivot period for divergence detection
Source (Close or High/Low)
Divergence type (Regular, Hidden, or Both)
Minimum number of divergences to display
Maximum pivot points and bars to check
Toggle individual indicators on/off
Custom colors for each divergence type
Label display options (Full names, First letter, or Don't show)
Show divergence count option
Trading Applications
Trend Following:
Use VSLRT histogram to identify trend direction and strength
Enter trades when short-term and long-term trends align
Monitor forecast bars for potential trend continuation
Reversal Trading:
Watch for multiple regular divergences (3+ indicators)
Confirm with VSLRT color changes
Higher divergence count = stronger reversal signal
Trend Continuation:
Hidden divergences suggest trend will continue
Use during pullbacks in strong trends
Combine with VSLRT forecast for entry timing
Risk Management:
Divergence alerts can signal potential exits
VSLRT color changes can indicate stop-loss levels
Forecast helps anticipate trend exhaustion
Alert Conditions
Built-in alert conditions for:
Positive Regular Divergence Detected
Negative Regular Divergence Detected
Positive Hidden Divergence Detected
Negative Hidden Divergence Detected
Any Positive Divergence
Any Negative Divergence
Tips for Best Results
Multiple Timeframe Analysis: Check divergences on higher timeframes for more reliable signals
Confirmation: Wait for bar close (enabled by default) to avoid false signals
Volume Context: Stronger VSLRT signals occur during high volume periods
Divergence Count: More simultaneous divergences = higher probability signal
Trend Alignment: Best results when divergences align with overall trend direction
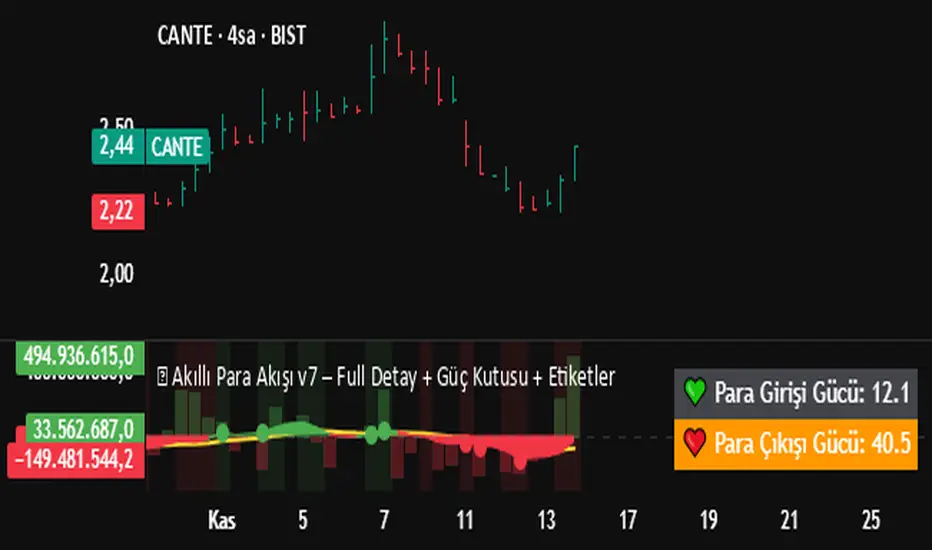
💰 Akıllı Para Akışı v7 – Full Detay + Güç Kutusu + Etiketler✅ Everything Included:
✔ Money Flow
✔ RSI (Relative Strength Index)
✔ Momentum Filter
✔ Price Change Analysis
✔ Smart Money Zone Detection
✔ Strength Score (0–100)
✔ Dual Power Box (Inflow/Outflow Strength)
✔ Full-Detail BUY/SELL Labels
✔ Alert System (BUY & SELL)
✔ Optimized for Bottom Panel Display
RSI + MACD Multi-Timeframe StrategyThis strategy combines the Relative Strength Index (RSI) from the daily timeframe with the Moving Average Convergence Divergence (MACD) from the 4-hour timeframe to generate precise long entry and exit signals.
The system uses a multi-timeframe approach to align longer-term trend conditions with shorter-term momentum shifts — allowing traders to catch dips with confirmation and exit before reversals.
🧠 Strategy Logic
✅ Long Entry Condition:
- RSI on the daily (1D) timeframe is oversold (below your defined threshold)
- MACD on the 4H timeframe crosses above the signal line
→ A long trade is opened when these two align
✅ Long Exit Condition:
- RSI on the daily timeframe is overbought
- MACD on the 4H timeframe crosses below the signal line
→ The long trade is closed when these two conditions are met
💡 This strategy currently supports long entries only. Short logic can be added if needed.
📊 Indicator Components
🔹 RSI (Relative Strength Index):
- A momentum oscillator that measures the speed and magnitude of price changes.
- Helps identify overbought (potential sell) and oversold (potential buy) conditions.
- Applied on the 1D timeframe (by default) to reflect broader market trend or exhaustion levels.
🔹 MACD (Moving Average Convergence Divergence):
- A trend-following momentum indicator based on moving averages.
- The MACD Line (fast EMA - slow EMA) crossing above the Signal Line indicates bullish momentum.
- Used here on the 4-hour timeframe (by default) for shorter-term momentum confirmation.
🔹 Multi-Timeframe (MTF) Logic:
- Uses request.security() to pull higher timeframe data (1D for RSI, 4H for MACD).
- Ensures no repainting, as it only uses closed candles from the higher timeframe.
- Aligns longer-term signals with shorter-term entries, reducing false signals.
📈 Plotting Options
The script includes a plot selector input allowing you to toggle between:
- RSI Plot (with overbought/oversold lines)
- MACD Plot (MACD line and signal line)
- This helps visualize signal conditions clearly on your chart.
🛠 Customization
- RSI & MACD settings are fully configurable
- RSI and MACD timeframes can be adjusted independently
⚠️ Disclaimer
This strategy is provided for educational and informational purposes only.
It is not financial advice or a recommendation to buy or sell any asset.
Past performance does not guarantee future results. Always test strategies in a simulated environment before live use, and consult with a licensed financial advisor for investment decisions.

RMBS Smart Detector - Multi-Factor Momentum System v2# RMBS Smart Detector - Multi-Factor Momentum System
## Overview
RMBS (Smart Detector - Multi-Factor Momentum System) is a proprietary scoring method developed by Ario, combining normalized RSI and Bollinger band positioning into a single composite metric.
---
## Core Methodology
### Buy/Sell Logic
Marker (green or red )appear when **all four filters** pass:
**1. RMBS Score (Momentum Strength)**
From the formula Bellow
Combined Range: -10 (extreme bearish) to +10 (extreme bullish)
Signal Thresholds:
• BUY: Score > +3.0
• SELL: Score < -3.0
2. EMA Trend Filter
BUY: EMA(21) > EMA(55) → Uptrend confirmed
SELL: EMA(21) < EMA(55) → Downtrend confirmed
3. ADX Strength Filter
Minimum ADX: 25 (adjustable 20-30)
ADX > 25: Trending market → Signal allowed
ADX < 25: Range-bound → Signal blocked
4. Alternating Logic
Prevents signal spam by requiring alternation:
✓ BUY → SELL → BUY (allowed)
✗ BUY → BUY → BUY (blocked)
________________________________________
Mathematical Foundation
RMBS Formula: scoring method developed by Ario
RMBS = (RSI – 50) / 10 + ((BB_pos – 50) / 10)
where:
• RSI = Relative Strength Index (close, L)
• BB_pos = (Close – (SMA – 2 σ)) / ((SMA + 2 σ) – (SMA – 2 σ)) × 100
• σ = standard deviation of close over lookback L
• SMA = simple moving average of close over lookback L
• L = rmbs_length (period setting)
This produces a normalized composite score around zero:
• Positive → bullish momentum and upper band dominance
• Negative → bearish momentum and lower band pressure
• Near 0 → neutral or transitional zone
Input Parameters
ADX Threshold (default: 25)
• Lower (20-23): More signals, less filtering
• Higher (28-30): Fewer signals, stronger trends
• Recommended: 25 for balanced filtering
Signal Thresholds
• BUY: +3.0 (adjustable)
• SELL: -3.0 (adjustable)
Visual Options
• Marker colors
• Background highlights
• Alert settings
________________________________________
Usage Guidelines
How to Interpret
• 🟢 Green Marker: All conditions met for Bull condition
• 🔴 Red Marker: All conditions met for Bear condition
• No Marker: Waiting for confirmation
________________________________________
Important Disclaimers
⚠️ Educational Purpose Only
• This tool demonstrates multi-factor technical analysis concepts
• Not financial advice or trade recommendations
• No guarantee of profitability
⚠️ Known Limitations
• Less effective in ranging/choppy markets
• Requires proper risk management (stop-loss, position sizing)
• Should be combined with fundamental analysis
⚠️ Risk Warning
Trading involves substantial risk of loss. Past performance does not indicate future results. Always conduct your own research and consult professionals before trading.
________________________________________
Open Source
Full Pine Script code available for educational study and modification. Feedback and improvement suggestions welcome.
“All logic is presented for research and educational visualization.”
